
I know most of us don’t go into our Ph.D. programs on the assumption that it will lead us to vast riches and the adoration of the masses. And I know that Ph.D. programs aren’t just job training programs. But in the end, formal education is presumably supposed to lead to a life that is in some way more fulfilling that our less-educated counterfactual, whether those rewards come in the form of increased earning potential, non-monetary job amenities like job security and benefits, living a life aligned with our values and strengths, or something. Otherwise, why pay the substantial opportunity costs of getting a Ph.D.? Previously on this blog, I’ve covered cross-institutional and rank-based pay differences and cross-sectional differences in post-secondary teacher pay by Ph.D. discipline. However, the question remains: How does salary differ by Ph.D. discipline for recent cohorts in their first jobs?
Review: Disciplinary Differences in Faculty Pay
Key Insights from the Bureau of Labor Statistics
First, let’s briefly review my prior post on this subject. Using summary data from the Bureau for Labor Statistics, I found five tiers of pay by discipline for all postsecondary teachers:
- Elite Professions: Law, Health Specialties, and Economics (average pay > $130k).
- Slightly Less Elite Professions: Engineering, Architecture, Business, Other Physical Sciences (average pay $112-121k).
- Most Hard Sciences, Some Social Sciences, & Art: Physics, Computer Science, Political Science, Anthropology and Archaeology, Chemistry, Biology, Forest & Conservation Science, Environmental Science, Art/Drama/Music, Area/Ethnic/Cultural Studies (average pay low six-figures).
- Other Social & Hard Sciences, Humanities, & Non-Elite Professions: Geography, Sociology, Agriculture, Math, Psychology, History, Communications, Philosophy/Religion, Family & Consumer, Foreign Language, Library, Recreation & Fitness, English, Nursing (average pay $86-98k).
- Middle Class Professions: Criminal Justice & Law Enforcement, Social Work, Education, Career & Technical Education (average pay $68-83k).
Unanswered Questions
These cross-sectional differences are informative, but difficult to interpret. Several important questions are outstanding, such as:
- How much of the disciplinary differences in faculty pay are within- as opposed to between-institution? One potential explanation for the lower than expected average pay of math professors, for instance, is that every single college or university in the country probably has a math department, but other disciplines are probably not as well represented across the span of institution types. I’ll try to address this topic in future work (though the data will be harder to come by).
- How much of these disciplinary differences are driven by cohort differences in job type and quality? I speculated that the surprisingly high pay of Art, Drama, and Music professors may indicate fields where well-paid, tenured, full professors are still common but new Ph.D.s have a very difficult time getting high-quality academic jobs.
- How much better is pay in non-educational industries, and how does that vary by discipline? It may be that some fields have poor prospects in higher ed but good prospects in government or industry. Note that the prior post examined the pay of postsecondary teachers, not all Ph.D.s.
This Post
This post addresses questions #2-3 by looking at salary in first jobs for new Ph.D. graduates by discipline and industry in the 2023 wave of the Survey of Earned Doctorates. By looking at the most recent graduating Ph.D. cohort, we’ll have a better idea of what may lie ahead for current and prospective Ph.D. students than we would get from a cross-section of Ph.D.s.
Data: 2023 Survey of Earned Doctorates
I know you want me to get right to the findings, but didn’t your advisor teach you the devil is in the details? So let’s talk about the dataset and what it can and can’t tell us.
What is this Survey, Anyway?
If you’re asking me this, you either got your Ph.D. outside the U.S., haven’t gotten it yet, or are a full professor who can no longer remember anything that happened before 1997. That’s because it’s fielded by the National Science Foundation to every new Ph.D. graduate for a given academic year – in other words, it attempts to be a census of new graduates. And it’s been fielded every academic year since 1958! Like the U.S. decennial Census, there is inevitably some undercount (91.2% of the 57,862 U.S. Ph.D. graduates in 2023 completed it, so not too bad), but it’s the best resource we have to understand new Ph.D. graduates’ first jobs.
What Does it Measure?
Be a good scholar and go check out the documentation yourself. It covers tons of basics, like where and in what you got your Ph.D., basic demographics, parental educational attainment, and – the focus of today’s post – postgraduation plans, including:
- Primary and secondary work activities
- Source and type of financial support
- Type and location of employer
- Annual salary
How Did You Access It?
You can access detailed data on Ph.D. discipline by applying to access the raw restricted data, but I accessed summary data through the Restricted Data Analysis System. While the raw restricted data would be preferable for more granular analyses, for overview purposes this tool is perfectly adequate in all but one respect.
What Disciplines Does it Cover?
Unfortunately the spectrum of disciplines described in the RDAS is limited and subject to uneven levels of detail. Although the SED gathers detailed disciplinary codes (see Table A-4 on the methodology page), it does not release this level of detail, and the level of detail it does release is uneven across major areas of scholarship. This is presumably due to deductive disclosure concerns, though I didn’t see this stated anywhere explicitly. As a result, out of the 306 detailed disciplines discussed in Table A-4, only 29 are available for analysis in RDAS:
- Life Sciences:
- Agricultural sciences and natural resources
- Biological and biomedical sciences
- Health sciences
- Physical Sciences and Earth Sciences:
- Chemistry
- Geosciences, atmospheric, and ocean sciences
- Physics and astronomy
- Mathematics and Computer Sciences:
- Computer and information sciences
- Mathematics and statistics
- Psychology and Social Sciences:
- Psychology
- Economics
- Political science and government
- Sociology
- Other social sciences (incl Anthropology)
- Engineering:
- Bioengineering and biomedical engineering
- Chemical engineering
- Civil engineering
- Electrical, electronics, and communications engineering
- Materials science engineering
- Mechanical engineering
- Other engineering (incl Aerospace, Industrial)
- Education:
- Education administration
- Education research
- Teacher education and teaching field
- Other education
- Humanities and Arts:
- History
- Languages and literature (English and foreign)
- Other humanities and arts
- Other Non-Science and Engineering Fields:
- Business management and administration
- Communication and other non-S&E fields
So, as you can see, engineering gets quite a bit of detail, while humanities and arts must settle for History, Languages and Literature, and Other. The smallest N reported for a detailed field is 627 for Sociology, so I suspect the threshold for including a detailed discipline in the RDAS tables was not far below that.
Findings
Finally! The beautiful graphs you’ve all been waiting for.
Ph.D. Discipline and First Job Mean and Median Salary
I’ll start with a simple graph of mean and median first job pay for the full 2023 graduating cohort, separated out by identified disciplines available in the SED RDAS.
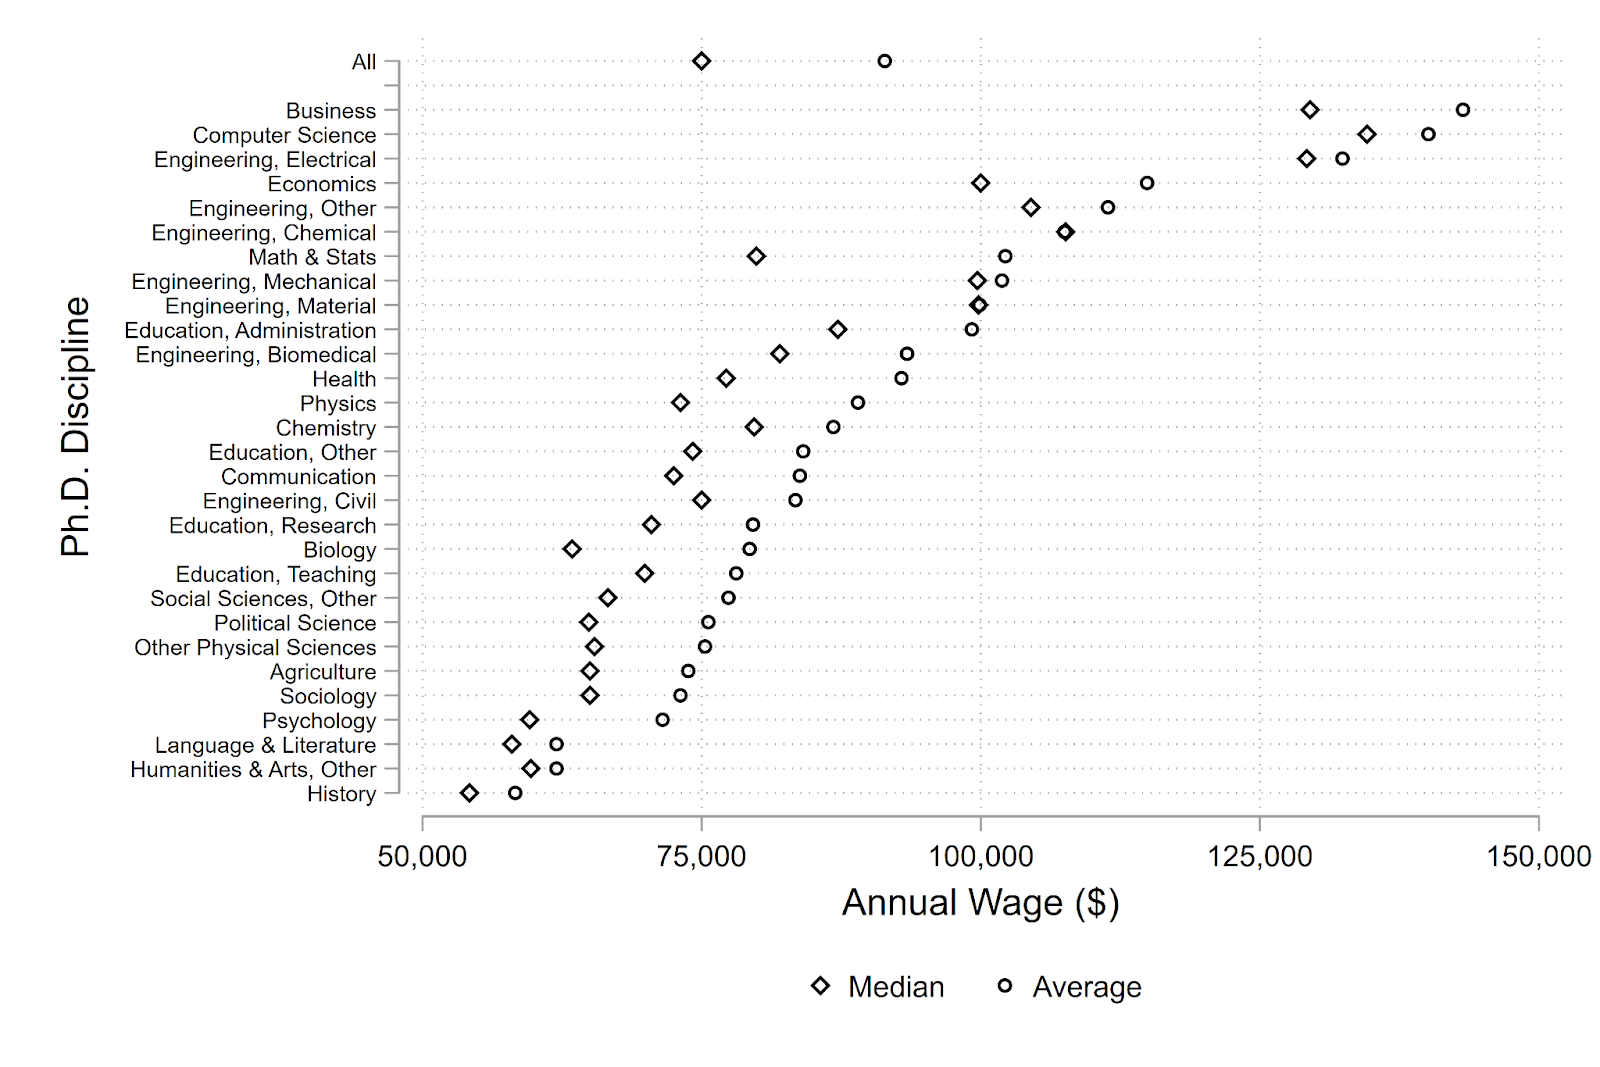
Overall Means and Medians
The first thing that pops out to me here is that the average/median spread is significant for this cohort of Ph.D. graduates as a whole, with an average of $91,400 but a median of $75,000. These are not terrible numbers – the median individual earnings for full-time, year-round workers in the U.S. in 2023 was $61,440 (see Table A-6 here). However, half of these graduates earned less than $75,000 since that’s how medians work, and for this group it’s not clear to what degree earning a Ph.D. increased their earning potential. Of course, as is generally the case, the average is higher than the median, in this case by $16,400, suggesting there is a long right tail of earnings under the hood of these summary measures.
Disciplinary Tier #1: Business and Tech?
To see one explanation for why this might be, we need only consider the rows of the graph below the first. The first thing that leaps off the screen is the first tier of three very highly-paid disciplines:
- Business (average $143k, median $130k)
- Computer science (average $140k, median $135k)
- Electrical engineering (average $132k, median $129k)
Not only do these favored disciplines have high expected pay, but CS and EE also have relatively low average/median spreads, suggesting that these high numbers are not driven by a lucky subset of outliers. New graduates in these fields are doing quite well for themselves overall. I suspect these numbers are heavily influenced by who works in industry, but there are likely spillovers into academic pay as well for competitive recruitment.
Disciplinary Tier #2: Econ, Most Engineers, Math, and… Educational Administration?
The second tier of disciplines includes the following:
- Economics (average $115k, median $100k)
- Engineering, Other (average $111k, median $105k)
- Engineering, Chemical (average $108k, median $108k)
- Math & Stats (average $102k, median $80k)
- Engineering, Mechanical (average $102k, median $100k)
- Engineering, Material (average $100k, median $100k)
- Education, Administration (average $99k, median $87k)
Here we find econ, several types of engineering, math & stats, and educational administration for some reason. Again, I expect the engineers’ high salaries are in part due to high pay in industry, but we’ll check that below. Math and Statistics, interestingly, has the largest average/median spread ($22,300) of any discipline, perhaps due to high pay in industries like finance and tech.
Disciplinary Tier #3: Other Engineers, Other Physical Scientists, Health, More Education
The third tier of disciplines to my overly-trained eye are as follows:
- Engineering, Biomedical (average $93k, median $82k)
- Health (average $93k, median $77k)
- Physics (average $89k, median $73k)
- Chemistry (average $87k, median $80k)
- Education, Other (average $84k, median $74k)
- Communication (average $84k, median $73k)
- Engineering, Civil (average $83k, median $75k)
Tier 3 contains the remaining engineering subdisciplines, health, physics, chemistry, and (somewhat surprisingly) other education and communication. What I find most interesting here is that we can see a huge spread in engineering Ph.D.s’ initial earnings by the type of engineering in which they earned their degree. At the high end with an average pay of $132k, we have the electrical engineers, whereas the average civil engineer new graduate earns nearly $50k less in their initial job (perhaps because they are more likely to work in government than business).
Disciplinary Tier #4: Even More Education, Bio, Social Sciences, and Ag
Here’s the fourth tier:
- Education, Research (average $80k, median $71k)
- Biology (average $79k, median $63k)
- Education, Teaching (average $78k, median $70k)
- Social Sciences, Other (average $77k, median $67k)
- Political Science (average $76k, median $65k)
- Other Physical Sciences (average $75k, median $65k)
- Agriculture (average $74k, median $65k)
- Sociology (average $73k, median $65k)
- Psychology (average $72k, median $60k)
Tier 4 includes the non-econ social sciences, biology, more educational subdisciplines, and agriculture. Here it’s instructive to examine the pay range among education Ph.D.s based on specialty. In this particular hierarchy, educational administration sits on top with an average pay of $99k, whereas educational research is down here slumming it with the social scientists with an average initial pay of $80k. Finally, I’ll note that even here in tier 4, the median initial salary pays above the national median earnings ($61k) for all fields but one (psychology, whose comparatively high average kept it in tier 4).
Disciplinary Tier #5: Don’t Go Into the Humanities, Kids
Finally we come to tier 5:
- Humanities & Arts, Other (average $62k, median $60k)
- Language & Literature (average $62k, median $58k)
- History (average $58k, median $54k)
The main thing that distinguishes this group is its very low average ($10k below the bottom of tier 4) and median (all below national median) pay. If you’re considering a Ph.D. in one of these fields, you’ll want to go in knowing this, and probably reconsider unless you’re independently wealthy (perhaps because you followed my Coast FI, then Apply blueprint!). And that’s coming from a former history major who switched to one of the Tier 4 disciplines in his second year in college.
Median Wages by Postdoc versus Employment
Disciplines likely vary quite a lot in the rate at which first jobs are likely to be postdocs rather than permanent employment, which could drive some of the above results. This graph distinguishes the two.
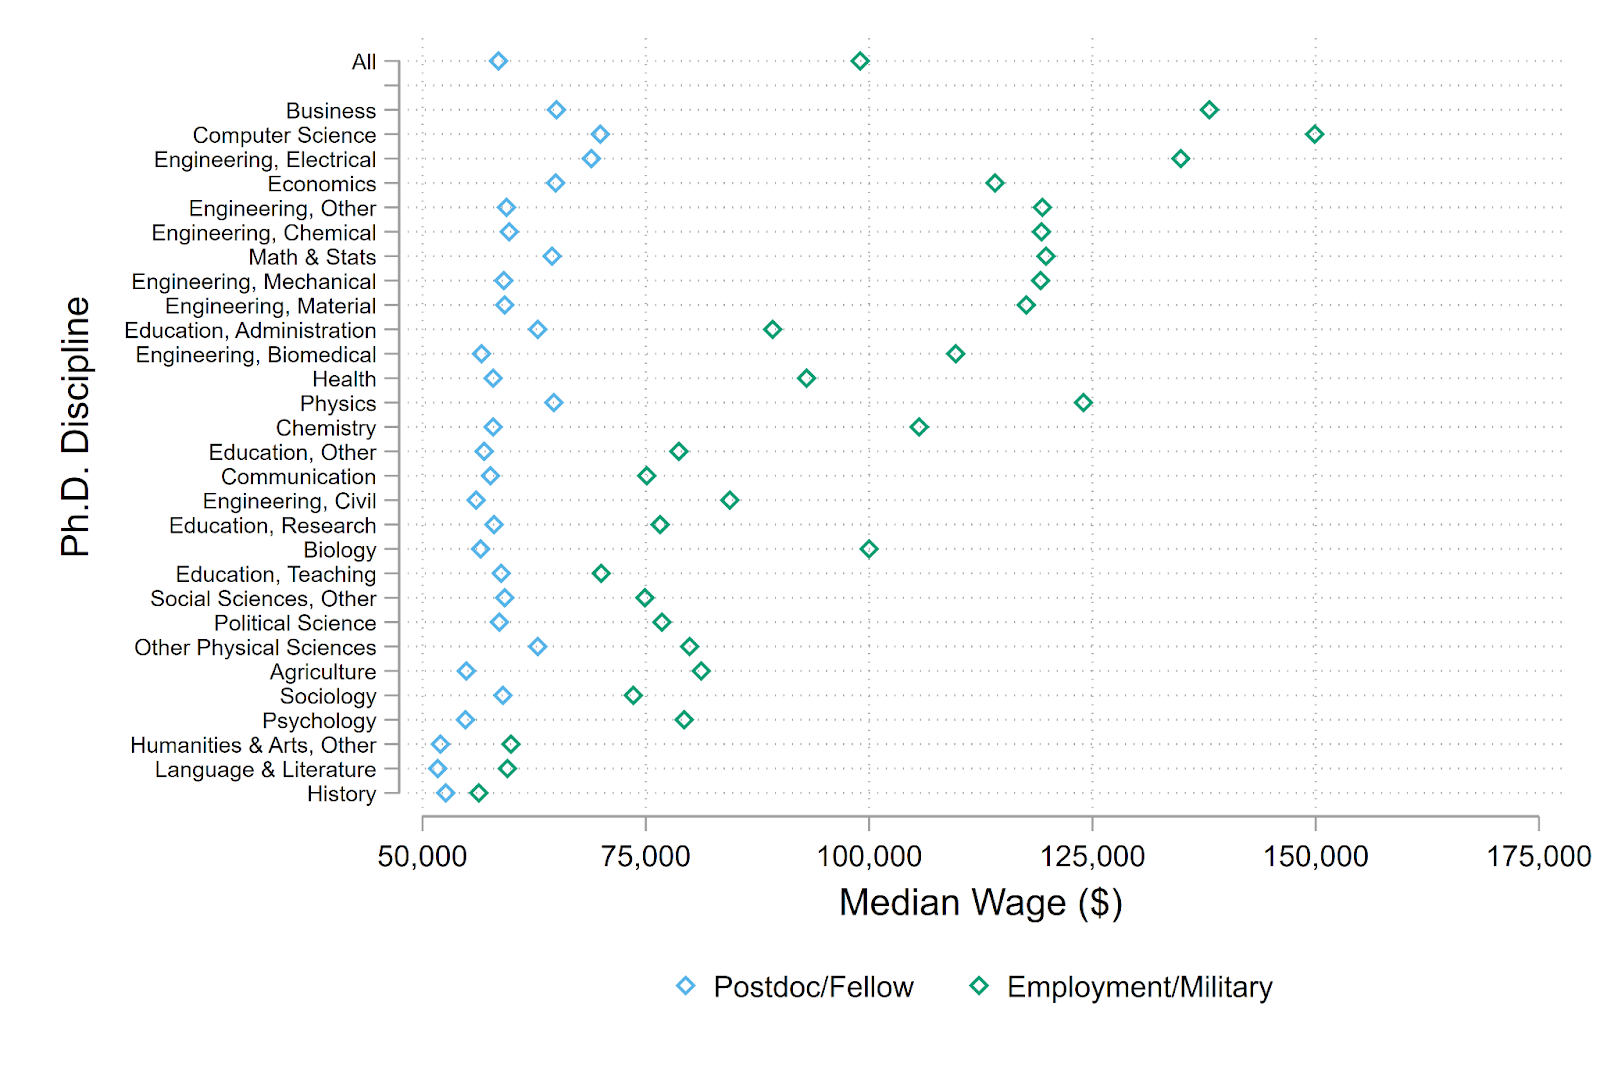
As you would expect, there is little cross-disciplinary variation in postdoc pay. However, there are some noteworthy changes in the non-postdoc employment pay tiers. In fact, I’ll now divide them into 4 tiers:
- Tier 1 remains the same (business, computer science, electrical engineering)
- Tier 2 retains several members, with econ, various types of engineering (other, chemical, mechanical, material), and math/stats remaining. However, removing postdocs introduces some new members: Physics, biomedical engineering, chemistry, and biology now join this tier, suggesting their initial employment pay was dragged down by postdocs relative to the fields above them. Educational administration drops out, suggesting its central tendencies were inflated by a low share of postdocs for new graduates (see below).
- Tier 3 now consists of education, communication, social sciences, other physical sciences, and agriculture.
- The bottom tier (now Tier 4) remains Humanities & Arts (other), Language & Literature, and History.
For additional context, here’s the table of the percentage of new Ph.D. grads employed in postdocs in 2023.
| Discipline | Percent Postdoc (Among Employed) |
|---|---|
| Other Physical Sciences | 62% |
| Biology | 59% |
| Physics | 58% |
| Psychology | 58% |
| Engineering, Biomedical | 45% |
| Agriculture | 44% |
| Math & Stats | 43% |
| Chemistry | 42% |
| Political Science | 39% |
| All | 37% |
| Engineering, Civil | 37% |
| History | 36% |
| Engineering, Material | 35% |
| Sociology | 33% |
| Health sciences | 32% |
| Engineering, Material | 32% |
| Social Sciences, Other | 32% |
| Engineering, Chemical | 28% |
| Engineering, Other | 26% |
| Humanities & Arts, Other | 25% |
| Computer Science | 21% |
| Economics | 21% |
| Languages & Literature | 20% |
| Engineering, Electrical | 17% |
| Education, Research | 16% |
| Communication | 16% |
| Education, Other | 11% |
| Business | 11% |
| Education, Teaching | 10% |
| Education, Administration | 5% |
These results make the change in tiers once postdocs are separated out make a great deal of sense. For instance, Educational Administration has the lowest percentage of postdocs among employed new graduates, and dropped out of its previous, surprisingly high, tier once postdocs versus other employment were separated out. In the other direction, physics, biomedical engineering, chemistry, and biology joined tier 2 when only non-postdoc employment was examined, and these fields have all have very high percentages of new graduates working in postdocs.
Median Wages by First Job Industry
The other big hidden variable in the initial figure is first job industry.
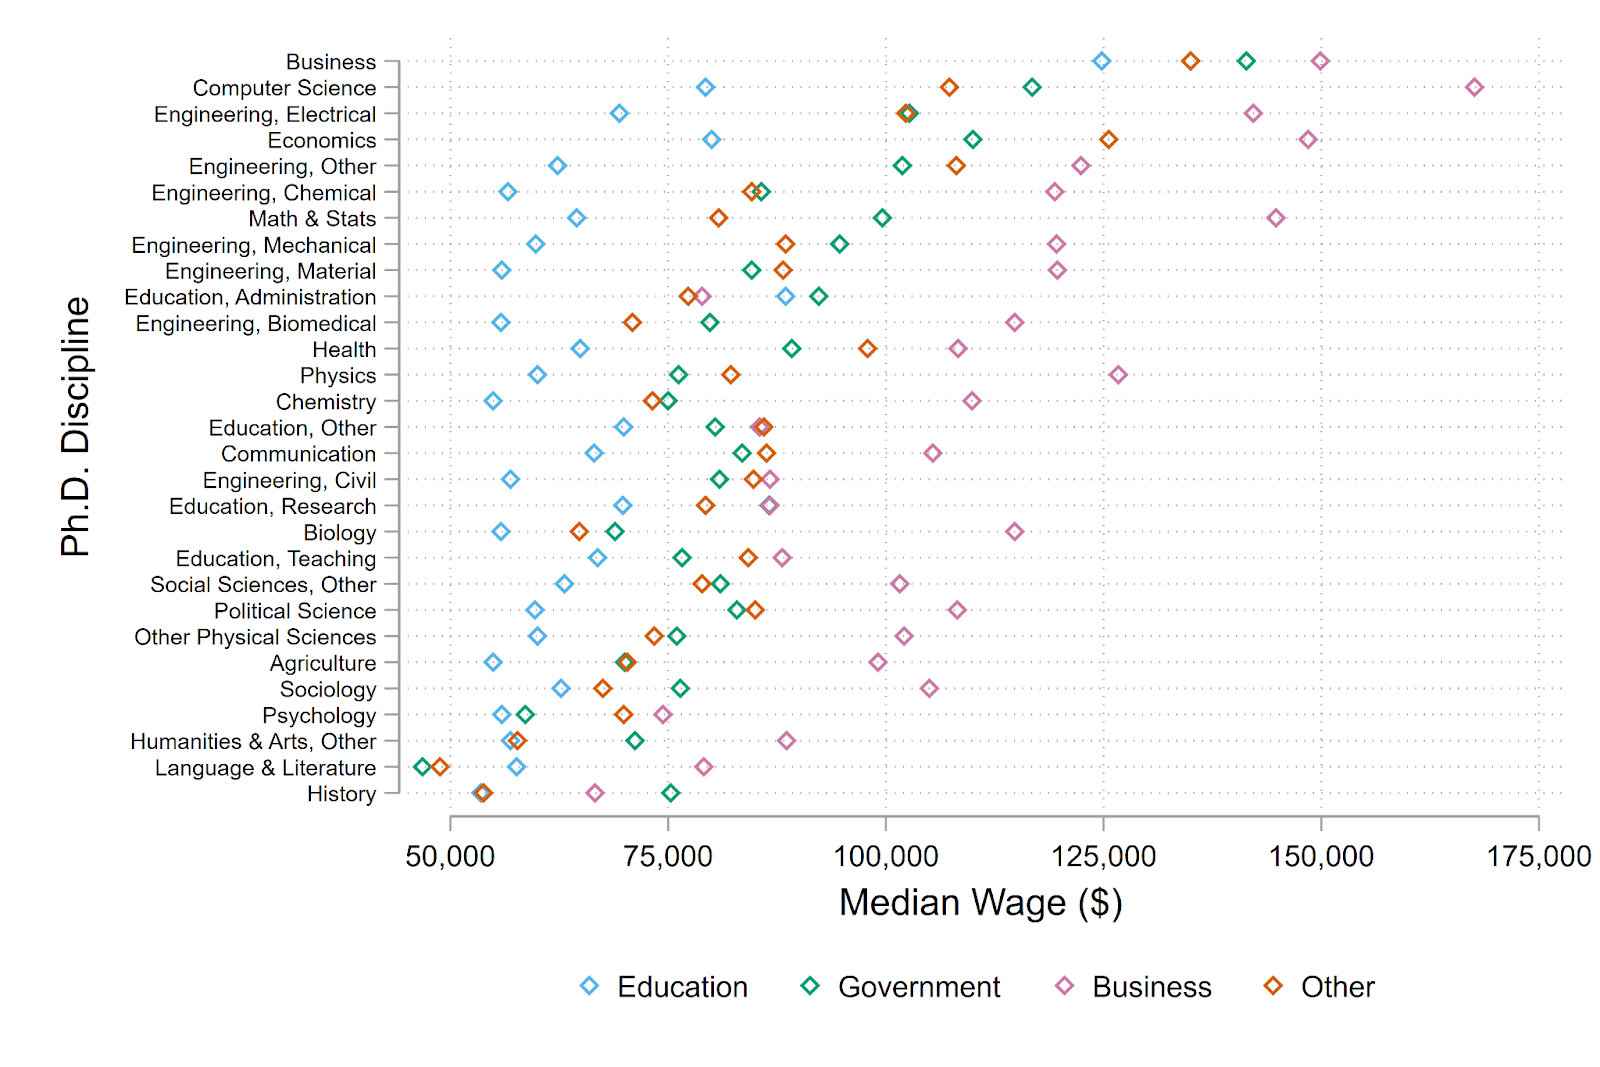
There’s a lot of detail in this figure to peruse, but I’ll just hit a few highlights:
- In every non-education/history discipline, new graduates make more in business than in other industries.
- In every discipline other than language & literature and educational administration, new graduates make less in education than in other industries.
- There’s no strong pattern for the relative median earnings in government vis-a-vis other.
- The size of the business/education median pay spread varies enormously.
I think points 1, 2, and 4 are all critical to understand. Even in fields where postdocs are uncommon, there is a substantial pay gap between education and business and usually every other industry. Some of those differences are likely attributable to postdocs (the RDAS doesn’t allow me to account for this many variables at once), and likely some to cost of living, but the gaps are still quite large.
How large depends considerably on the discipline in question. The table below lists median pay in education, business, and the gap/ratio between them, sorted by the business-education gap.
| Discipline | Median, Business | Median, Education | Business – Education | Business / Education |
| Computer Science | 167,600 | 79,300 | 88,300 | 2.113 |
| Math & Stats | 144,800 | 64,500 | 80,300 | 2.245 |
| Engineering, Electrical | 142,200 | 69,400 | 72,800 | 2.049 |
| Economics | 148,500 | 80,000 | 68,500 | 1.856 |
| Physics | 126,700 | 60,000 | 66,700 | 2.112 |
| Engineering, Material | 119,700 | 55,900 | 63,800 | 2.141 |
| Engineering, Chemical | 119,400 | 56,600 | 62,800 | 2.110 |
| Engineering, Other | 122,400 | 62,300 | 60,100 | 1.965 |
| Engineering, Mechanical | 119,600 | 59,800 | 59,800 | 2.000 |
| Engineering, Biomedical | 114,800 | 55,800 | 59,000 | 2.057 |
| Biology | 114,800 | 55,800 | 59,000 | 2.057 |
| Chemistry | 109,900 | 54,900 | 55,000 | 2.002 |
| Political Science | 108,200 | 59,700 | 48,500 | 1.812 |
| Agriculture | 99,100 | 54,900 | 44,200 | 1.805 |
| Health | 108,300 | 64,900 | 43,400 | 1.669 |
| Sociology | 105,000 | 62,700 | 42,300 | 1.675 |
| Other Physical Sciences | 102,100 | 60,000 | 42,100 | 1.702 |
| Communication | 105,400 | 66,500 | 38,900 | 1.585 |
| Social Sciences, Other | 101,600 | 63,100 | 38,500 | 1.610 |
| Humanities & Arts, Other | 88,600 | 56,900 | 31,700 | 1.557 |
| Engineering, Civil | 86,700 | 56,900 | 29,800 | 1.524 |
| Business | 149,900 | 124,800 | 25,100 | 1.201 |
| Language & Literature | 79,100 | 57,600 | 21,500 | 1.373 |
| Education, Teaching | 88,100 | 66,900 | 21,200 | 1.317 |
| Psychology | 74,400 | 55,900 | 18,500 | 1.331 |
| Education, Research | 86,700 | 69,800 | 16,900 | 1.242 |
| Education, Other | 85,500 | 69,900 | 15,600 | 1.223 |
| History | 66,600 | 53,500 | 13,100 | 1.245 |
| Education, Administration | 78,900 | 88,500 | -9,600 | 0.892 |
For the first twelve disciplines here (CS through Chemistry), the opportunity cost for working in education rather than business is enormous – roughly double, with some small exceptions. Given that these disciplines have relatively high income within the education industry, they’re often forgoing an amount of money comparable to the business salaries of less well-paid disciplines, ranging $55-88k. This group exclusively consists of computer science, math/stats, engineering, and physics/biology/chemistry. In other words, these are all disciplines with clear application in industry.
Below this group, the next 9 disciplines (Poli Sci through Civil Engineering) in terms of education/business tradeoffs consist of several social sciences, health, other physical sciences, communication, and civil engineering. The Business / Education ratios in this group range from about 1.5-1.8. Due to the lower educational salaries, the absolute salaries forgone are also markedly lower than in the previous group, ranging $29-49k.
The next 7 disciplines (Business through History) face more modest business vs. education tradeoffs, with ratios ranging 1.2-1.4 and absolute differences ranging $13-25k. Business is perhaps somewhat surprising given its obvious applications to, well, business, but perhaps business professors manage to drive a harder bargain given the likely ease with which they could transition to non-academic pursuits. The other disciplines in this group consist of education, psychology, language & literature, and history. With the possible exception of psychology, it’s reasonable to expect this group to have greater difficulty transitioning to non-academic careers than many others with larger tradeoffs.
Finally, one discipline earns more money within the education industry than in business: Educational Administration. I suppose that makes a great deal of sense.
Distribution Across Pay Groupings by Discipline
All of the above figures focus on central tendencies. What about the pay distribution?
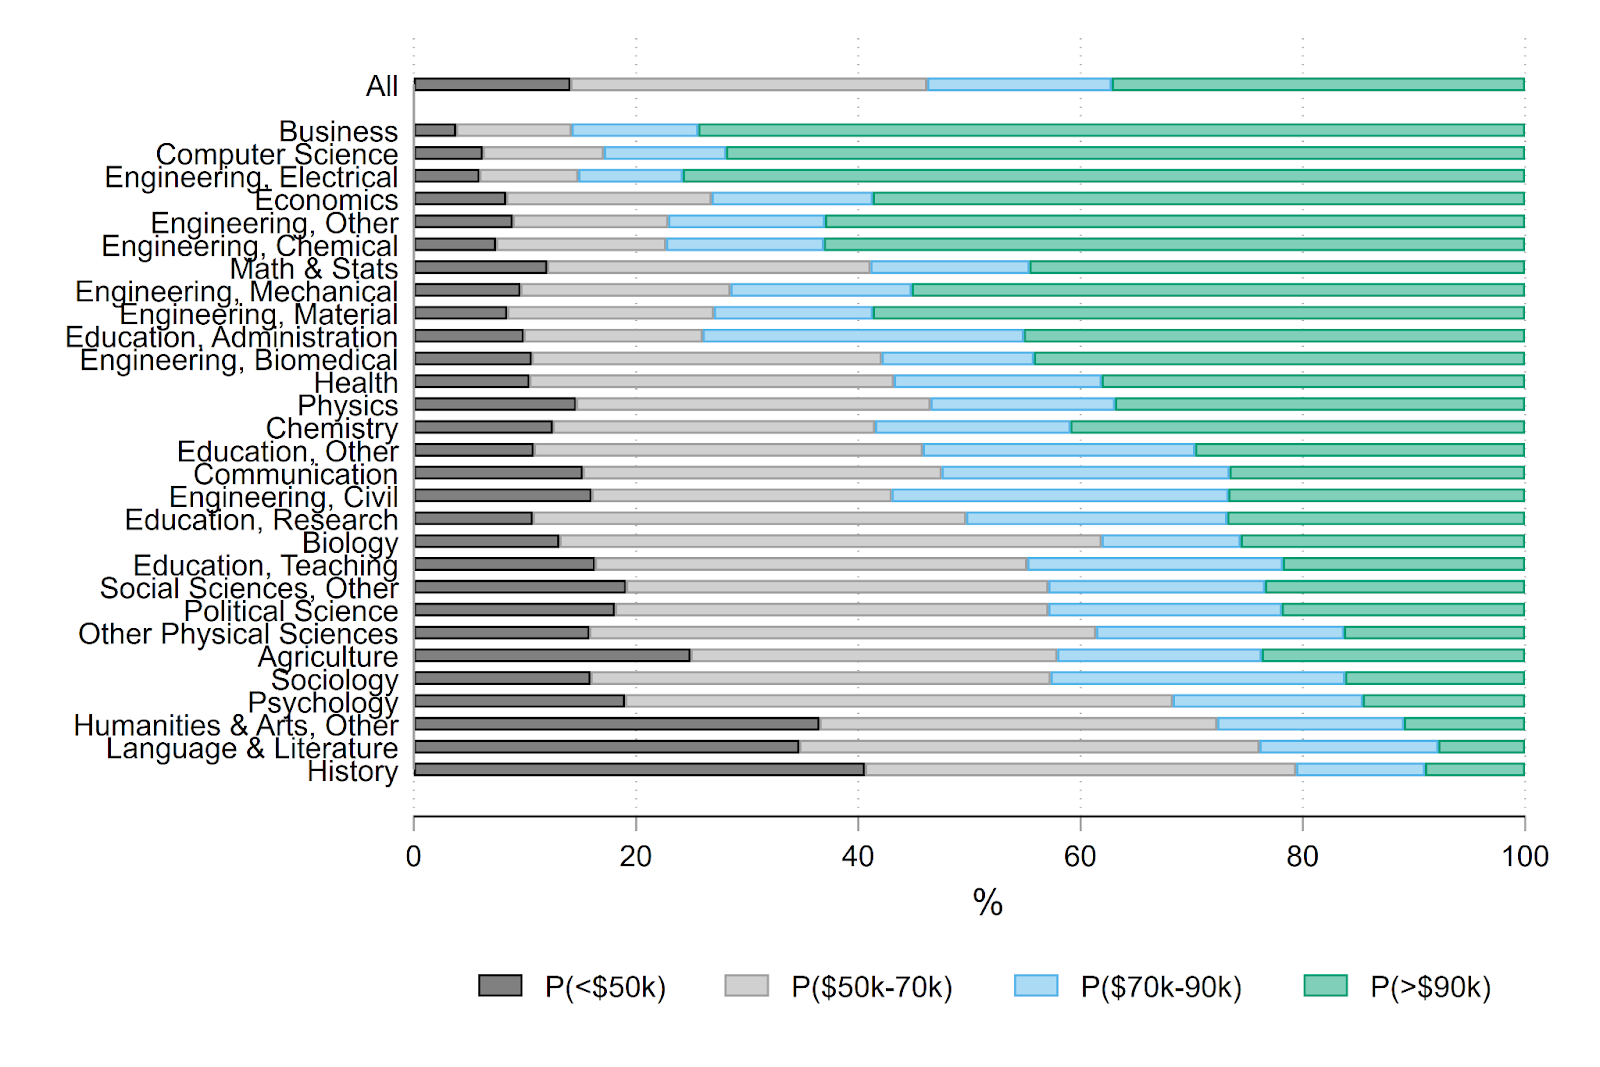
Here the data mostly break down like you would expect. For instance, about 70% of all three tier 1 disciplines make >$90k in their first position. On the other end of the hierarchy, 35-40% of tier 5 disciplines earn <$50k in their first position (and these aren’t disciplines where postdocs are common, though VAPs may be). However, a couple disciplines’ initial pay distributions do stick out compared to their neighbors’:
- Agriculture: has more pay in the extreme ends of the distribution than its neighbors, with about 25% earning <$50k and about the same earning >$90k.
- Math & Stats: compared to the engineering disciplines around it, this field has a lower share of new graduates earning >$90k and a somewhat higher share earning <$50k.
Final Thoughts
Some of the findings in this post may seem obvious: computer science, engineers, and economists are kicking the rest of our butts, while humanities, language/literature, and history are charity cases. We could have probably guessed that. Furthermore, relatively little of those differences are explained by postdoc versus permanent employment, with the exception of some fields with strong applications in industry and high postdoc percentages. Ok, maybe we could have guessed that too. Third, just about everyone makes more in business than in education for their first jobs. Yeah, we know (though some of this difference may reflect cost of living differences between cities and college towns).
Still, I think two details are noteworthy as takeaways:
- The extent of cross-disciplinary inequality: The median CS, EE, or econ new PhD earns nearly double the median for all Ph.D.s. Meanwhile, about 40% of new humanities & arts (other), language & literature, and history Ph.D.s are earning <$50k at the outset of their careers.
- The universality of the business over education advantage: At least in nominal terms, there is no field besides educational administration where the expected pay in business is lower than that in academia for first jobs. The gap is starkest for CS, engineering, and hard sciences.
Next in this Series
Since this post is already pretty long, I plan to address a two more aspects of these data in followup posts in the weeks to come:
- Trends in discipline-specific pay since 2017: Have any fields meaningfully risen or fallen? How much year-to-year volatility is there, especially during the COVID-19 pandemic?
- Initial employment status trends by discipline: Has the percentage employed, employed in postdocs, and employed in different industries changed over time?
So stay tuned for more!