
This is my second post (of three planned) in the Inequality at the Starting Gate series on disciplinary differences in job circumstances at time of Ph.D.s’ graduation. In the first post in this series, I examined disciplinary differences in first job pay among the 2023 Ph.D. graduating cohort. In my earlier post, I looked at disciplinary differences in postsecondary teacher pay in the U.S. Today, I’ll look at recent trends in discipline-specific first job pay. Have the disciplines with the highest and lowest pay been in their places a long time, or has the rank order evolved over time? Is everyone’s real first job pay trending downward, upward, or what? Let’s find out.
Data: 2017-23 Survey of Earned Doctorates
To find out, I’m looking at the full available time series from the Survey of Earned Doctorates (SED) Restricted Data Access System (RDAS), which unfortunately covers only 2017-23 at time of writing. This is unfortunate as the survey itself has been fielded since 1958, but the detailed discipline variable I’m interested in isn’t publicly available in conjunction with income data anywhere in earlier years. (And sure, you can apply for restricted data access, but what am I, a real researcher?!?)
See Inequality at the Starting Gate #1 for more details on the data.
Besides bringing in the 2017-22 data tables, the other big change I’m making here is to adjust salary data for inflation to the nearest dollar, using the -inflate- user-written ado in Stata, which pulls directly from the latest CPI tables from the St. Louis Fed. All income data presented will be scaled in 2023 dollars.
Finally, I’ll also note that there was a significant change in how NSF coded fields of study in 2021, but as you’ll see below there’s no sign of this having a discernable bearing on our findings. Actually, we do have a weird data anomaly to deal with, but it wasn’t in 2021.
Results
Detailed results are available in the supplemental tables here. In the main post, I’ll just hit the highlights.
Average Pay – Don’t Believe Your Eyes
Let’s start with trends in average pay for first post-graduation jobs for Ph.D.s 2017-23, separately by discipline.
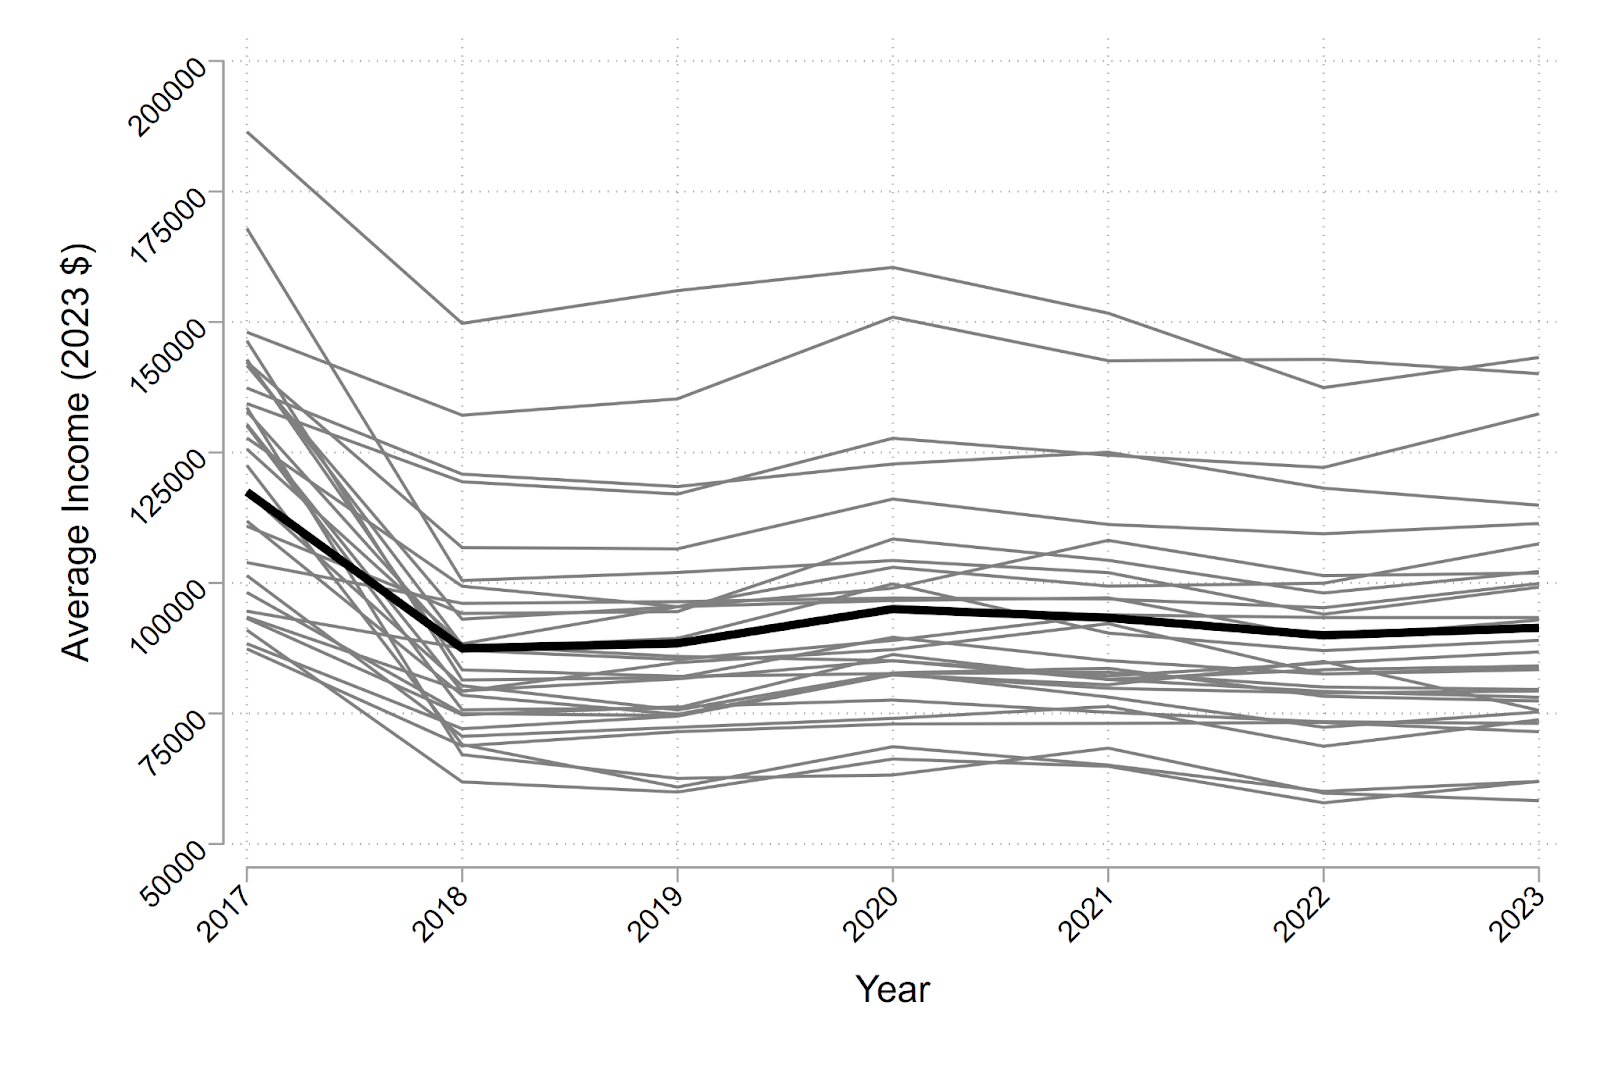
I know you can’t pick out the individual disciplines there, but bear with me. The first thing that pops off the screen is a downward shift 2017-18 for all disciplines. Frankly, I don’t believe this result. But I double checked and unlike what’s usually the case, I actually didn’t screw this up – it’s right there in the (non-inflation-adjusted) data as you can see here. Here’s 2017:
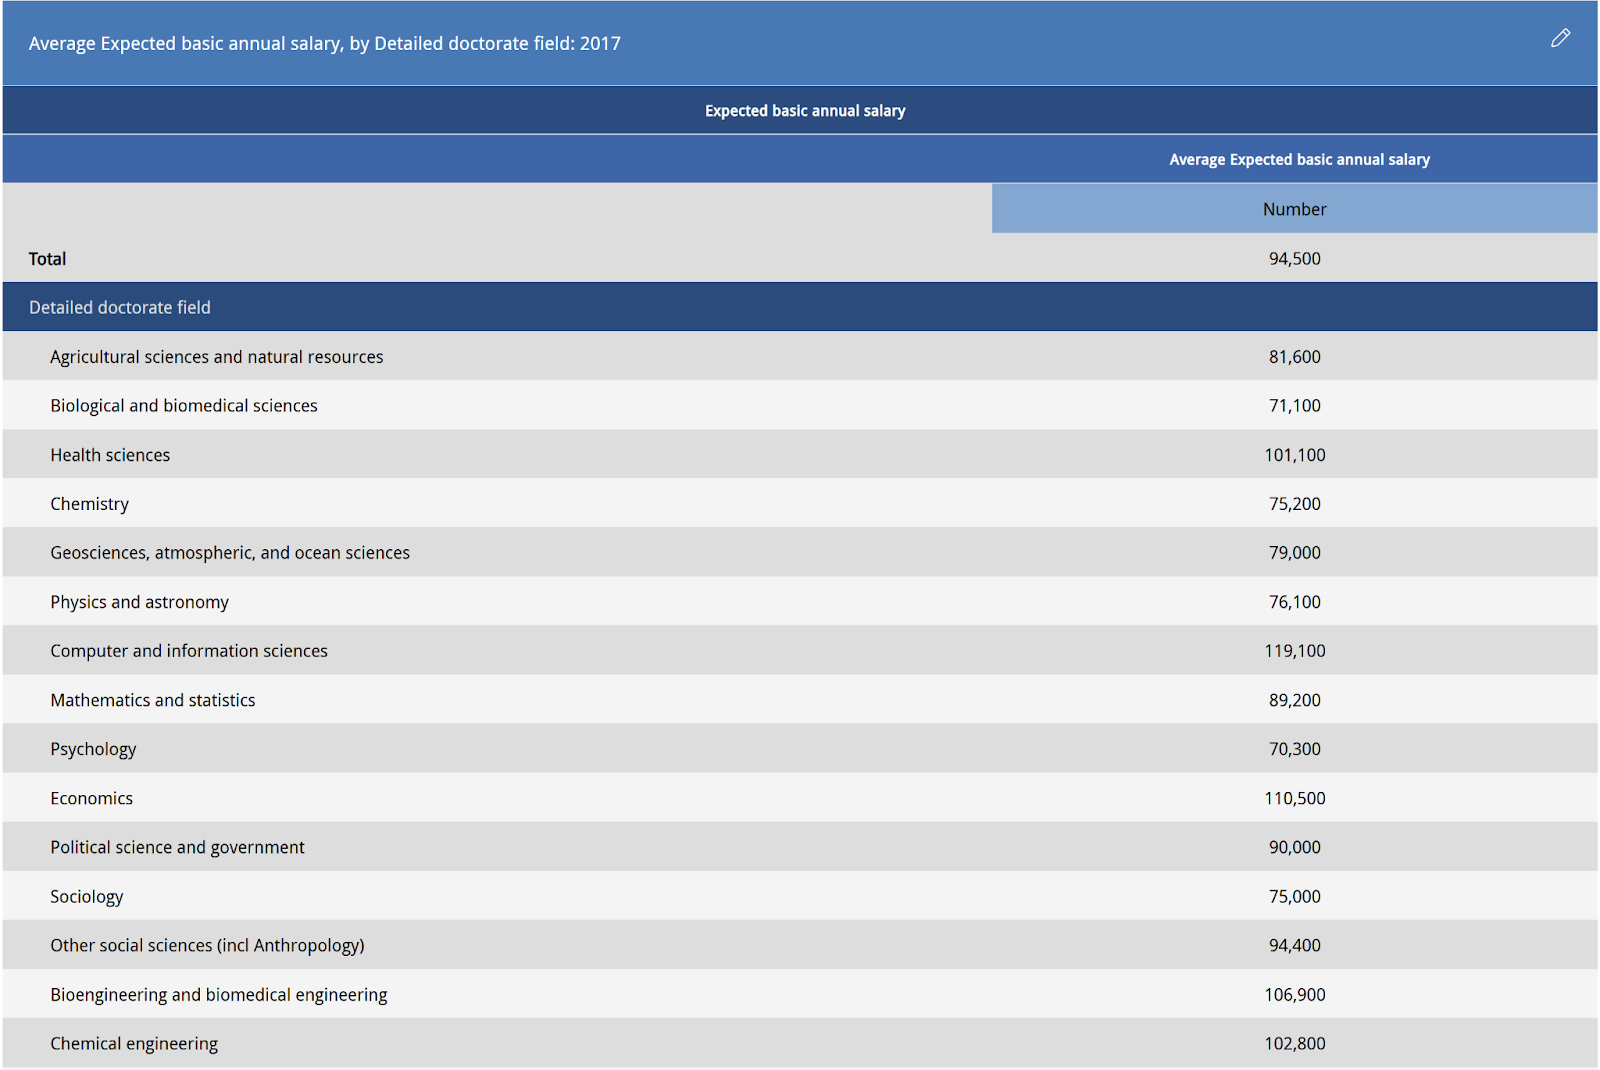
And here’s 2018:
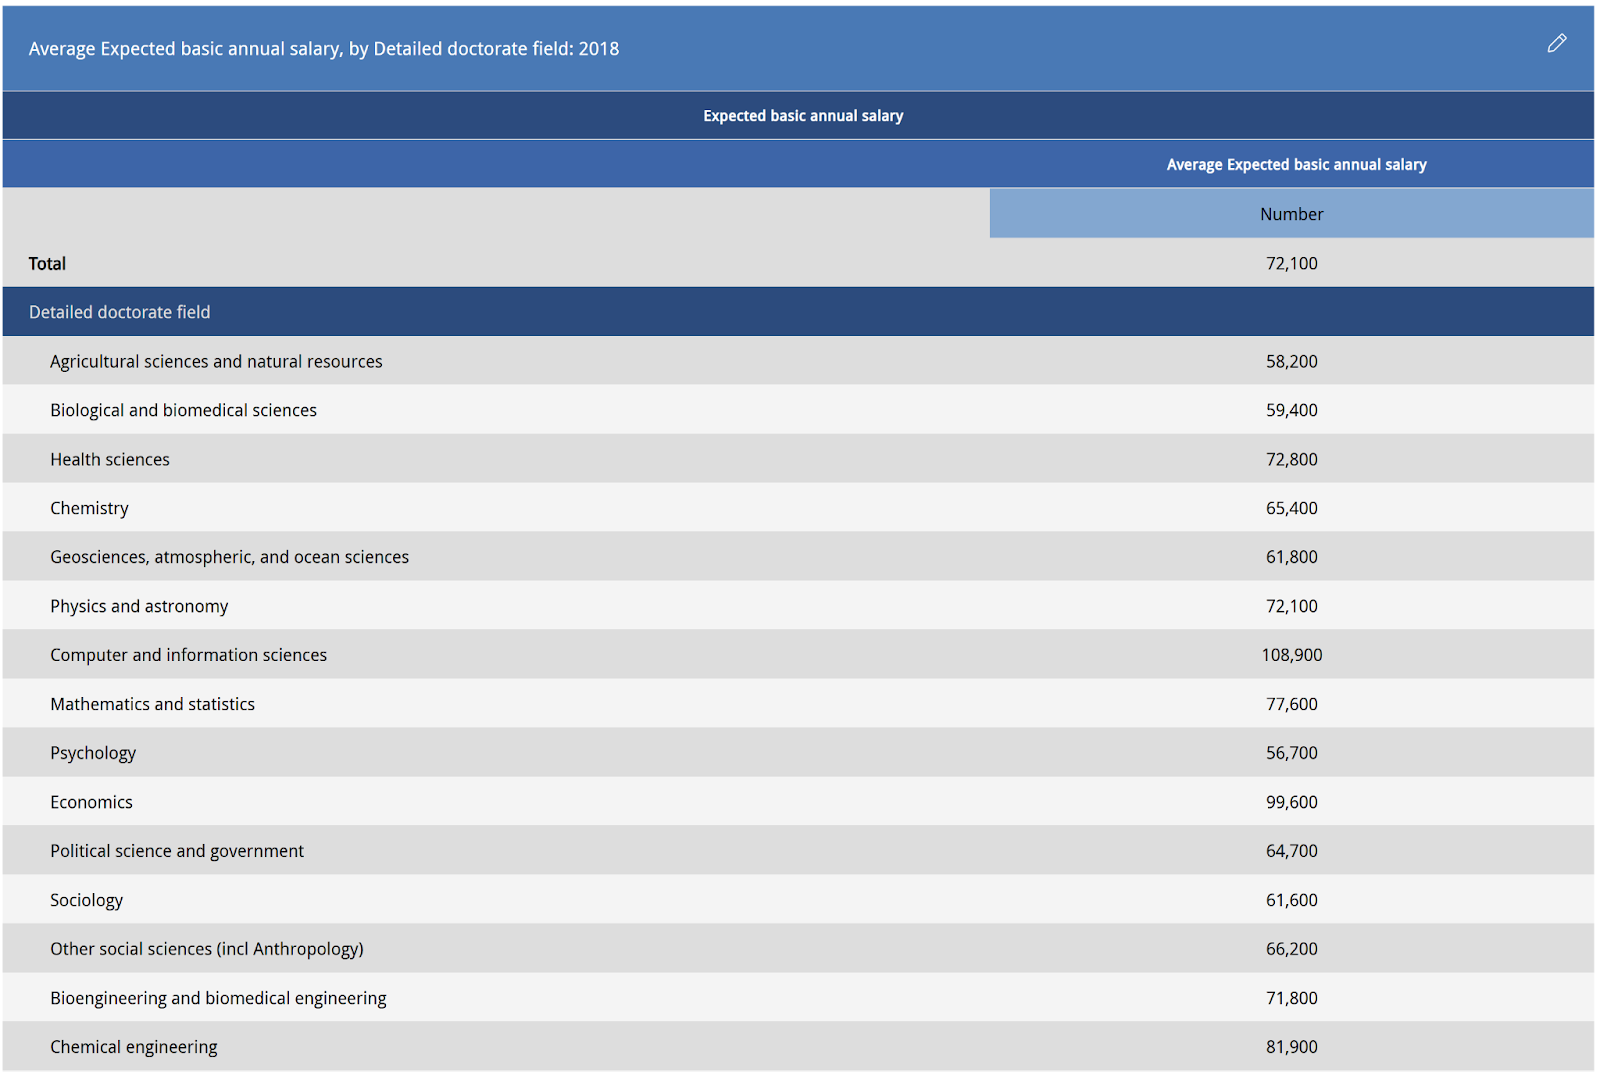
WTF? Did we all take a 24% pay cut that year and nobody told me?!? You see it across all fields too, so it’s not just that one new computer science Ph.D. created the runaway hit TRMPSCKS app and massively skewed the average. I checked whether there was some major methodological change in 2018 that could explain this, and there was nothing that I could find. If you find or know of something that could explain this, please let me know.
Luckily, there are no such unexplained issues with the median salary data, so we’ll stick with that from here out.
Median Pay – Data You Can Believe In!
Let’s check out the median pay trends.
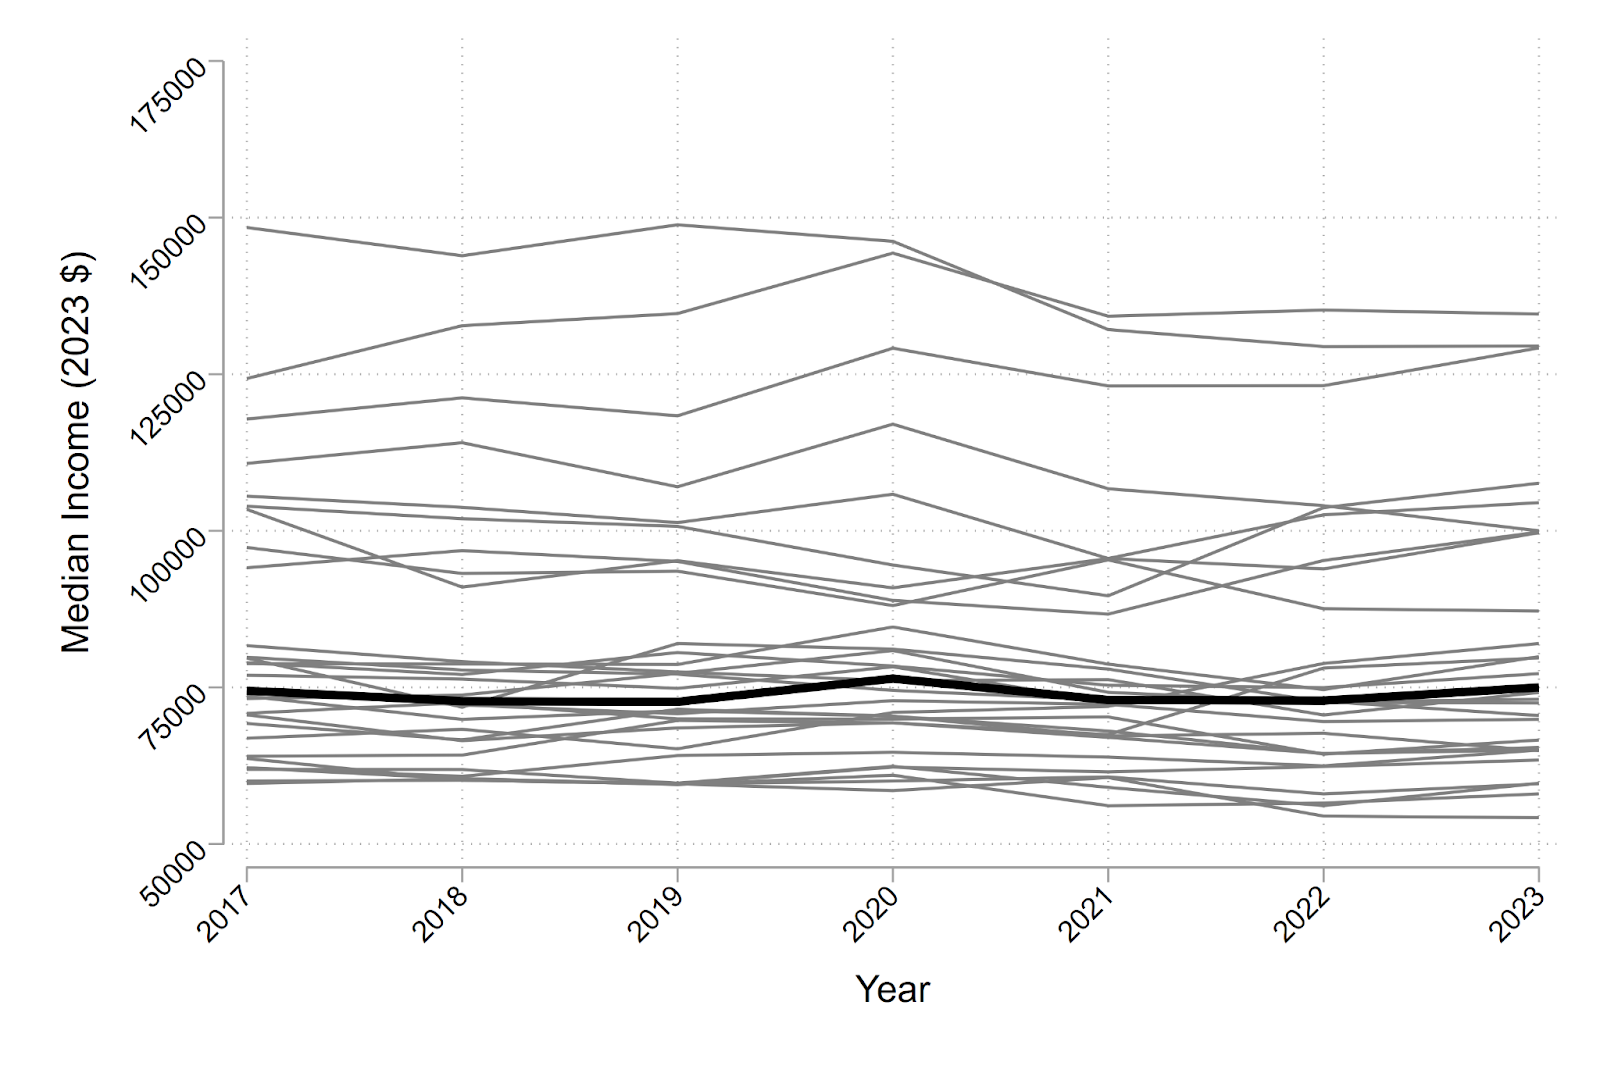
Ahhhh, that’s better. Now we can start to make sense of everything.
Think back to the disciplinary tiers from post 1. Tier 1 was computer science, business, and electrical engineering, in that order, and you can see them in the top three rows in the graph above. Those three have dominated median pay over the full 7 years of data. Interestingly, their fortunes have converged over time: computer science (the top line in 2023) has trended upward over time (peaking in 2020, then declining), business (the middle line in 2023) was #1 until 2019 when it started trending downward even more starkly, and electrical engineering (the third line from the top in 2023 has climbed slowly but non-monotonically upward.
You can also clearly make out Tier 2 (chemical engineering, other engineering, economics, material engineering, mechanical engineering, and – yes, I’m still surprised by this – educational administration. The rank order has varied over time, but the tier itself has maintained pretty clear separation from tier 1 above and tier 3 below over the full time period, so this is a consistent grouping. Within this tier, however, there is some divergence in fortune, however. Two disciplines’ fortunes have declined by about $10k in real median income over this short period of time – economics ($111k to $100k) and educational administration ($97k to $87k). The other fields (all engineers) experienced some downward movement both before and during the pandemic, but have largely rebounded close to where they began on an inflation-adjusted basis.
Tiers 3-5, meanwhile, are much less distinct than the first two, and the separation between them largely emerged post-pandemic. There were differences in pay pre-pandemic, of course, but it was more of a continuous gradient. To unpack these values, we’ll need to look at tables of 2023-2017 median pay differences.
Which Fields Gained and Lost the Most Pay?
Let’s see the table! This and all subsequent stats are median pay, by the way.
| Discipline | 2023 | 2017 | Difference |
| Chemistry | 79,700 | 64,018 | 15,682 |
| Engineering, Biomedical | 82,000 | 66,877 | 15,123 |
| Engineering, Electrical | 129,200 | 117,843 | 11,357 |
| Computer Science | 134,600 | 124,307 | 10,293 |
| Engineering, Material | 99,800 | 94,101 | 5,699 |
| Biology | 63,400 | 59,668 | 3,732 |
| Engineering, Chemical | 107,600 | 103,921 | 3,679 |
| Agriculture | 65,000 | 62,154 | 2,846 |
| Math & Stats | 79,900 | 78,811 | 1,089 |
| All | 75,000 | 74,460 | 540 |
| Physics | 73,100 | 73,217 | -117 |
| Psychology | 59,600 | 60,040 | -440 |
| Engineering, Other | 104,500 | 105,537 | -1,037 |
| Health | 77,200 | 78,935 | -1,735 |
| Humanities & Arts, Other | 59,700 | 61,905 | -2,205 |
| Engineering, Mechanical | 99,700 | 103,424 | -3,724 |
| Language & Literature | 58,000 | 62,154 | -4,154 |
| Social Sciences, Other | 66,600 | 70,855 | -4,255 |
| Political Science | 64,900 | 69,239 | -4,339 |
| Communication | 72,500 | 76,946 | -4,446 |
| Education, Teaching | 69,900 | 74,460 | -4,560 |
| Engineering, Civil | 75,000 | 79,681 | -4,681 |
| Other Physical Sciences | 65,400 | 70,607 | -5,207 |
| Education, Other | 74,200 | 81,670 | -7,470 |
| Sociology | 65,000 | 73,590 | -8,590 |
| Education, Research | 70,500 | 79,805 | -9,305 |
| History | 54,200 | 63,645 | -9,445 |
| Education, Administration | 87,200 | 97,333 | -10,133 |
| Economics | 100,000 | 110,758 | -10,758 |
| Business | 129,500 | 148,423 | -18,923 |
Who had Chemistry registering the greatest gains in real median pay (+$15,682)? Not me, but as someone married to a Chemistry Ph.D. holder, I am not remotely surprised since based on this sample of N=1, I can only infer that chemistry Ph.D.s are all brilliant, hard working, and gorgeous. (Now let’s see if she actually reads these.)
Hot on the chemists’ heels in the 5-figure real gains club come the biomedical engineers (+$15,123), electrical engineers (+$11,357), and computer scientists (+$10,293). Behind them, five disciplines earned modest 4-figure real gains (material engineers, biologists, chemical engineers, and… agriculturalists?). These groups together gave new Ph.D.s as a whole a 7-year real median pay gain of $540 smackeroos. Unfortunately, the rest of us, my discipline included, are on the other side of null.
Some of these losses are quite substantial. It seems those who study money have a lot less of it, as noted before, with educational administrators right behind them. After that, we’ve got some bad news for the humanities, social science, and education, as these groups make up most of the remainder, with history, educational research, and sociology really pulling their (negative) weight.
Looking at these outcomes, though, I’m left to wonder how much of these trends are driven by changes in pay for non-postdoc, permanent positions, and how much is driven by the changing share of new Ph.D. graduates who take a postdoc. I’ll look at the latter in the next post; here, let’s look at trends in pay among those not taking a postdoc as their first job.
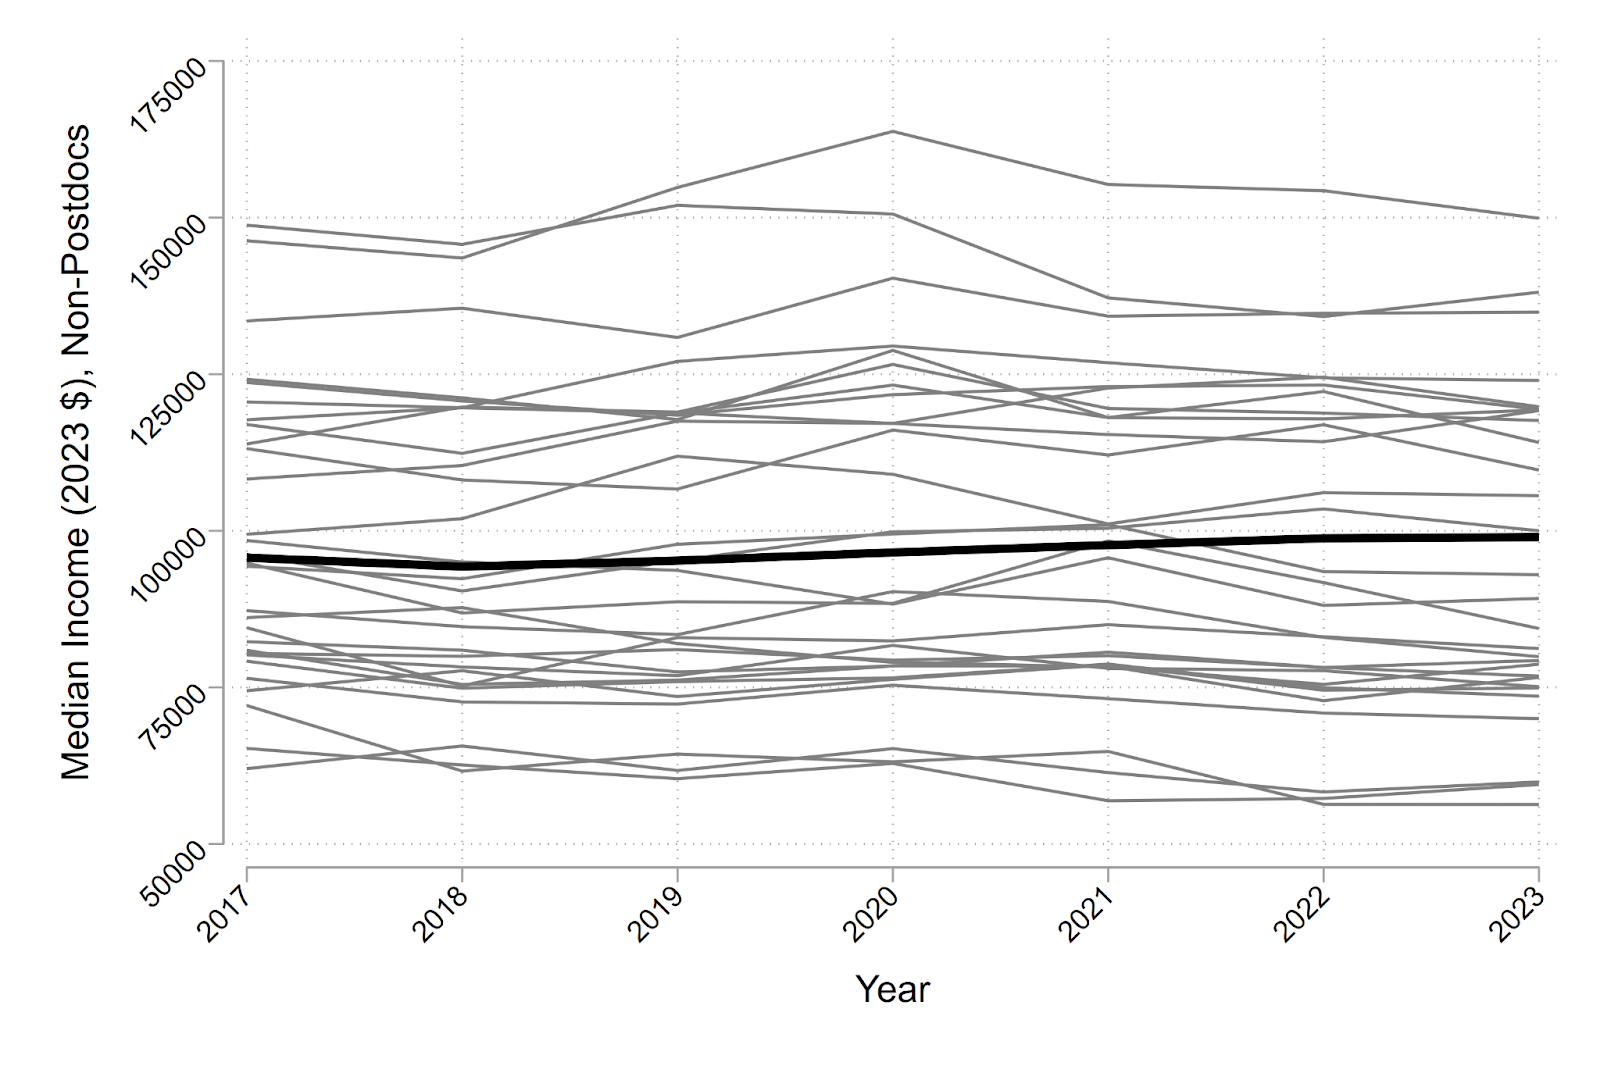
Trends in Non-Postdoc Pay
Here are the trends for those whose first job was something other than a postdoc. Here’s the graph version:
…And here’s the difference table:
| Discipline | 2023 | 2017 | Difference |
| Math & Stats | 119,800 | 108,272 | 11,528 |
| Chemistry | 105,600 | 99,446 | 6,154 |
| Biology | 100,000 | 96,214 | 3,786 |
| Engineering, Material | 117,600 | 113,866 | 3,734 |
| Computer Science | 149,900 | 146,310 | 3,590 |
| Physics | 124,000 | 120,578 | 3,422 |
| All | 99,000 | 95,717 | 3,283 |
| Engineering, Mechanical | 119,200 | 116,973 | 2,227 |
| Engineering, Electrical | 134,900 | 133,506 | 1,394 |
| Social Sciences, Other | 74,900 | 74,460 | 440 |
| Psychology | 79,300 | 80,427 | -1,127 |
| Health | 93,000 | 94,349 | -1,349 |
| Humanities & Arts, Other | 59,900 | 62,029 | -2,129 |
| Agriculture | 81,200 | 84,529 | -3,329 |
| Engineering, Biomedical | 109,700 | 113,120 | -3,420 |
| Economics | 114,100 | 117,719 | -3,619 |
| Political Science | 76,800 | 80,924 | -4,124 |
| Engineering, Other | 119,400 | 123,686 | -4,286 |
| Engineering, Chemical | 119,300 | 124,183 | -4,883 |
| Communication | 75,100 | 80,178 | -5,078 |
| Sociology | 73,600 | 79,184 | -5,584 |
| Education, Research | 76,600 | 82,291 | -5,691 |
| Language & Literature | 59,500 | 65,261 | -5,761 |
| Education, Teaching | 70,000 | 76,449 | -6,449 |
| Other Physical Sciences | 79,900 | 87,264 | -7,364 |
| Education, Other | 78,700 | 86,145 | -7,445 |
| Education, Administration | 89,200 | 98,451 | -9,251 |
| Engineering, Civil | 84,400 | 94,846 | -10,446 |
| Business | 138,100 | 148,796 | -10,696 |
| History | 56,300 | 72,098 | -15,798 |
There’s some evidence that many of the trends we saw above were driven by changing entrance into postdocs upon graduation. For one, real first job pay has increased for new Ph.D.s by $3.3k! That’s not the story we usually hear, though we’ll look at trends in employment status in the next post. Plus, for several fields the over-time trends are much more favorable when looking at non-postdoc employment only. For one, mathematicians/statisticians now show the biggest gains at $11.5k! And the dismal science’s fortunes are now looking substantially less dismal, so perhaps postdocs were driving some (but not all) of the economists’ negative trends.
On the other hand, some disciplines’ gains aren’t nearly so big in this table than before, especially engineers, so it may be that their trends were driven more by the declining share of graduates entering postdocs on graduation than in non-postdoc pay trends. Meanwhile, historians’ pay history is looking even worse here than it did in the overall table.
If we look at who is in the top half and bottom half of this table, it’s clear that things are looking up for many STEM Ph.D.s in the non-postdoc market, but looking pretty bad for everyone else.
Closing Thoughts
I suppose that was a lot of work to reach the conclusion that STEM are doing increasingly better than the rest of us (at least if they manage to avoid the postdoc hamster wheel), but here we are. This was an era where big tech and big consulting were scooping up Ph.D.s by the armful for spectacular salaries and RSUs, and more and more graduates in those fields were getting the memo that academia might not be the be-all, end-all of the good life. Maybe the rest of us got that memo too, but fewer of us took that path, whether by preference or choice.
Next time, I’ll close this series by digging into trends in employment status – whether employed at graduation, industry of employment, and postdoc vs other employment status. Stay tuned!